Thursday 18 December 2014

Winter Condensation and Frosty Windows

Another winter is upon us, and for many Canadians, that means having to deal with condensation and frosting on windows. Besides being a nuisance, excessive condensation on windows may eventually cause damage to window frames or finishes near the window opening. What causes condensation and frosting, and what can be done to prevent it?

Though occasionally beautiful, frost on a window is often a problem.

Condensation forms on surfaces that are colder than the dew point temperature (DPT) of the air. The maximum amount of water vapour that can mix with air depends on the temperature: warmer air can hold more moisture. Air at 20 °C can have nearly 23 times more water vapour than air at -20 °C! If air cools below its DPT, water vapour will leave the air to form condensation.

In the past, houses tended to stay dry because they were drafty and moisture in the home was quickly carried outdoors. Modern homes are constructed to minimize air leakage. This saves on heating costs, but also traps more moisture inside the home. At the same time, windows are relatively poor thermal insulators. A significant proportion of heat loss through windows is actually resisted by a thin layer of air that clings to the interior side of the window, rather than by the window material. The window material is analogous to the exterior siding of a wall and the air layer is analogous to the wall’s insulation. Anything outside the insulation gets very cold during winter. When warm, moist air from inside the home reaches one of these cold windows, the air cools and vapour condenses or freezes.

Most approaches to controlling condensation are simply measures to reduce the amount of water vapour in the home, which is equivalent to reducing the DPT. Here are some tips on reducing indoor humidity:

  • Turn off humidifiers.
  • Use a dehumidifier.
  • Use cold water for washing dishes and clothing.
  • Ensure dryers are properly vented to the exterior and that dryer ducts are not leaking.
  • Take quicker showers. Showering produces approximately 2.6 kg of vapour per hour (1 kg of vapour is equivalent to 1 L, or about 34 oz, of liquid water).
  • Use exhaust fans while cooking or showering. Cooking a meal for four people produces about 0.2 to 0.3 kg of water vapour on average.
  • Don’t boil water unnecessarily. Try brewing tea or preparing soup at a few degrees below boiling.
  • Store firewood in the garage or shed. Drying firewood produces 1 to 3 kg of vapour per day per cord of firewood.
  • Reduce the number of plants in the home. A typical house plant releases about 0.05 kg of water per day.
  • Open the windows or doors (at least once in a while) to increase ventilation. This will increase your heating bill, but it will also help remove moisture.
  • Install a heat recovery ventilator (HRV). Direct exchange of warm indoor air with cold outdoor air results in significant heat loss. HRVs perform this air exchange while reducing that heat loss by 75 to 85%.


Guidelines developed at the University of Minnesota recommend indoor humidity below 30% to control condensation when the outdoor temperature is -12 to -18 °C. However, it should be noted that low humidity can pose comfort and even health problems for some people. Complaints of chapped lips, dry skin, and dry nasal passages become increasingly likely as the indoor humidity drops below 30%. Low humidity also causes wood to shrink, which sometimes leads to warping or checking. Most flooring manufacturers recommend keeping humidity between 35% and 55% to protect hardwood floors. Other wooden items in the home like furniture and musical instruments may also be sensitive to low humidity. So if you can’t solve your condensation problems by reducing indoor humidity, there are still some other options that work by stopping moisture from reaching the cold surface or by ensuring the surface temperature doesn’t drop below the DPT. Here are some additional tips for controlling condensation:

  • Open drapes and blinds. This encourages air circulation at the window and keeps the window surface a little bit warmer.
  • Install a plastic film (window insulator kit). It is important to seal the plastic correctly so that air can’t leak around it. If the film leaks air it could actually exacerbate the condensation issues.
  • Install storm windows if not already present.
  • Check the window seals and take corrective action as necessary. In storm window assemblies, the inner window should be as airtight as possible and the outer window should be comparatively leaky, though not so leaky that it allows exterior air to chill the inner window.
  • Replace problem windows with more efficient models. Choose windows with a high Condensation Resistance Factor (CRF).


To summarize, condensation and frost form on windows because the windows are colder than the dew point temperature of the indoor air. Reducing vapour production and removing vapour from the home are often the best ways to eliminate condensation problems. If problems persist, repair or renovation work ranging from weather-stripping windows to replacing windows with more efficient models may need to be considered.

References
ASHRAE. Handbook of Fundamentals. American Society of heating Refrigeration and Air-conditioning Engineers, Atlanta, GA, 2009.

Hutcheon, N.B. and Handegord, G.O.P. Building Science for a Cold Climate. John Wiley & Sons, New York, NY, 1983.

Lohonyai, A.J. Frost fractals on a window, Personal photograph, November 2014.

Straube, J.F. and Burnett, E.F.P. Building Science for Building Enclosures, Building Science Press, Westford, MA, 2005.

TenWolde, A. and Pilon, C.L. “The Effect of Indoor Humidity on Water Vapor Release in Homes” in Thermal Performance of the Exterior Envelopes of Buildings X, American Society of heating Refrigeration and Air-conditioning Engineers, Atlanta, GA, 2007.

Trechsel, H.R. and Bomberg, M.T. (eds.) Moisture Control in Buildings: The Key Factor in Mold Prevention, 2nd edition, American Society for Testing and Materials, West Conshohocken, PA, 2009.
Saturday 8 November 2014

Effects of Winter on Fuel Economy

If you're pinching pennies, or maybe just nerdy about your fuel consumption, perhaps you've noted that your fuel efficiency gets a fair bit worse during the winter. For example, my classic Oldsmobile averages about 16.0 mpg (14.7 L/100 km) in the summer and only about 12.2 mpg (19.3 L/100 km) in the winter.

There are many factors affecting your fuel economy, like the rolling resistance of the tires and the car's aerodynamic drag. Winter conditions (mostly just the cold temperatures) tend to negatively impact several of these influencing factors, as outlined below. 

Aerodynamic Drag
Aerodynamic drag is the resisting force that air applies on a moving object like a ball, car, or aircraft. Basically, the object crashes into the air molecules in front of it. The air has to be pushed out of the way and the drag force comes from that air pushing back against the object. Large, bluntly shaped objects with rough surfaces experience a lot more drag than smaller objects with smooth surfaces shaped to gently push through the air. And large drag forces mean more energy is needed to overcome them. Think of the difference between slicing through cheese with a brick versus a knife. 

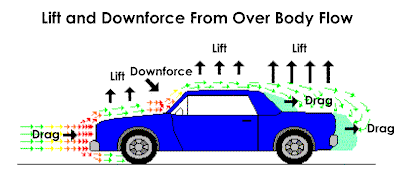
Diagram of lift and downforce from overbody flow
Diagram of the typical aerodynamic forces acting on a moving car

The drag force on an object, like your car, can be quantified using the formula:

F_D\, =\, \tfrac12\, \rho\, v^2\, C_D\, A

where FD is the drag force, ρ is the air density, v is the velocity, CD is a dimensionless drag coefficient, and A is the frontal area. So what's the effect of winter on drag force?

Sure, it could be argued that your car has a bit more area if it's got a layer of snow and ice on it. Similarly, the snow and ice make your car's surfaces rougher, so it could be argued that the drag coefficient increases as well. But those are negligible effects and don't explain the loss of fuel economy when it's cold but your car is clean. The real culprit here is air density. Cold air is denser than warm air, so the drag force is simply higher during winter. At -10 °C, the drag force is about 12% larger than at +20 °C. Here's a figure showing the density of air versus its temperature, assuming 50% humidity and 200 m elevation above sea level. The magnitude of the density will decrease at higher humidity and/or elevation, but the trend as a function of temperature is essentially unchanged.

Cold air is denser than warm air and the aerodynamic drag force is proportional to the air density.


Rolling Resistance
Your tires aren't perfectly circular: they form a flat area where they contact the road. 

contact patch migration
Deformed shape of a tire on a rigid surface during static (constant speed), acceleration, and braking conditions.

As the wheel turns, the tire is continuously being flattened out at the contact point (and returning to circular coming off the contact point). The rubber in tires exhibits an interesting material property known as hysteresis. Hysteresis is when the material behaves differently depending on whether it is being loaded or unloaded.
Stress-strain relation of a material with hysteresis. The path from A to B depends on whether the stress is increasing or decreasing. The shaded area between the two paths represents the energy lost due to hysteresis.

It takes some input of mechanical energy to cause the tire to go from the natural shape to the deformed shape. If rubber had no hysteresis, all of the mechanical energy would be returned during the reverse process, going from the deformed shape to the natural shape of the tire. But what we really see is that more energy is input during loading than is output during unloading. This loss of energy translates to lost fuel economy because some of the work done by the engine has to feed the energy consumption of the tires. Most of the rolling resistance from your wheels is from this energy absorbing behaviour of the material.

If you're wondering where the extra energy disappears to, the answer is heat. As the rubber keeps absorbing energy, receiving more mechanical energy than it gives back, it starts to heat up. This is why your tires are warm after a long drive. Of course, the temperature of your tires cannot increase indefinitely because eventually a steady-state heat transfer rate is achieved. The rate at which heat dissipates to the air increases with both increasing tire temperature and car velocity.

Okay, so how do winter conditions affect hysteresis? Well, the effect is more pronounced when the rubber is cold. So in the winter, tire rolling resistance is higher, especially if you're only taking short trips (remember that your tires begin to heat up as you drive). There's roughly 1% increase in rolling resistance for every 1 °C drop in temperature. But there's another cause. The hysteresis effect also increases as your tire pressure decreases. If your tire pressure is low, more deformation occurs in the tire as it rolls. And when the temperature of a gas decreases at a constant volume, the gas pressure has to drop in the same proportion (see Amontons' Law). That means your tire pressure drops when it's cold. Based on typical operating pressure and typical rolling resistance curves for tires on hard surfaces, rolling resistance increases by roughly 4% for every 1 psi drop in pressure below the recommended operating pressure. A typical car tire will experience approximately 1.5 psi drop in pressure for every 10 °C drop in temperature. So a 30 °C drop in temperature might increase your rolling resistance by about 50% if you don't remember to keep your tire pressure at optimum!

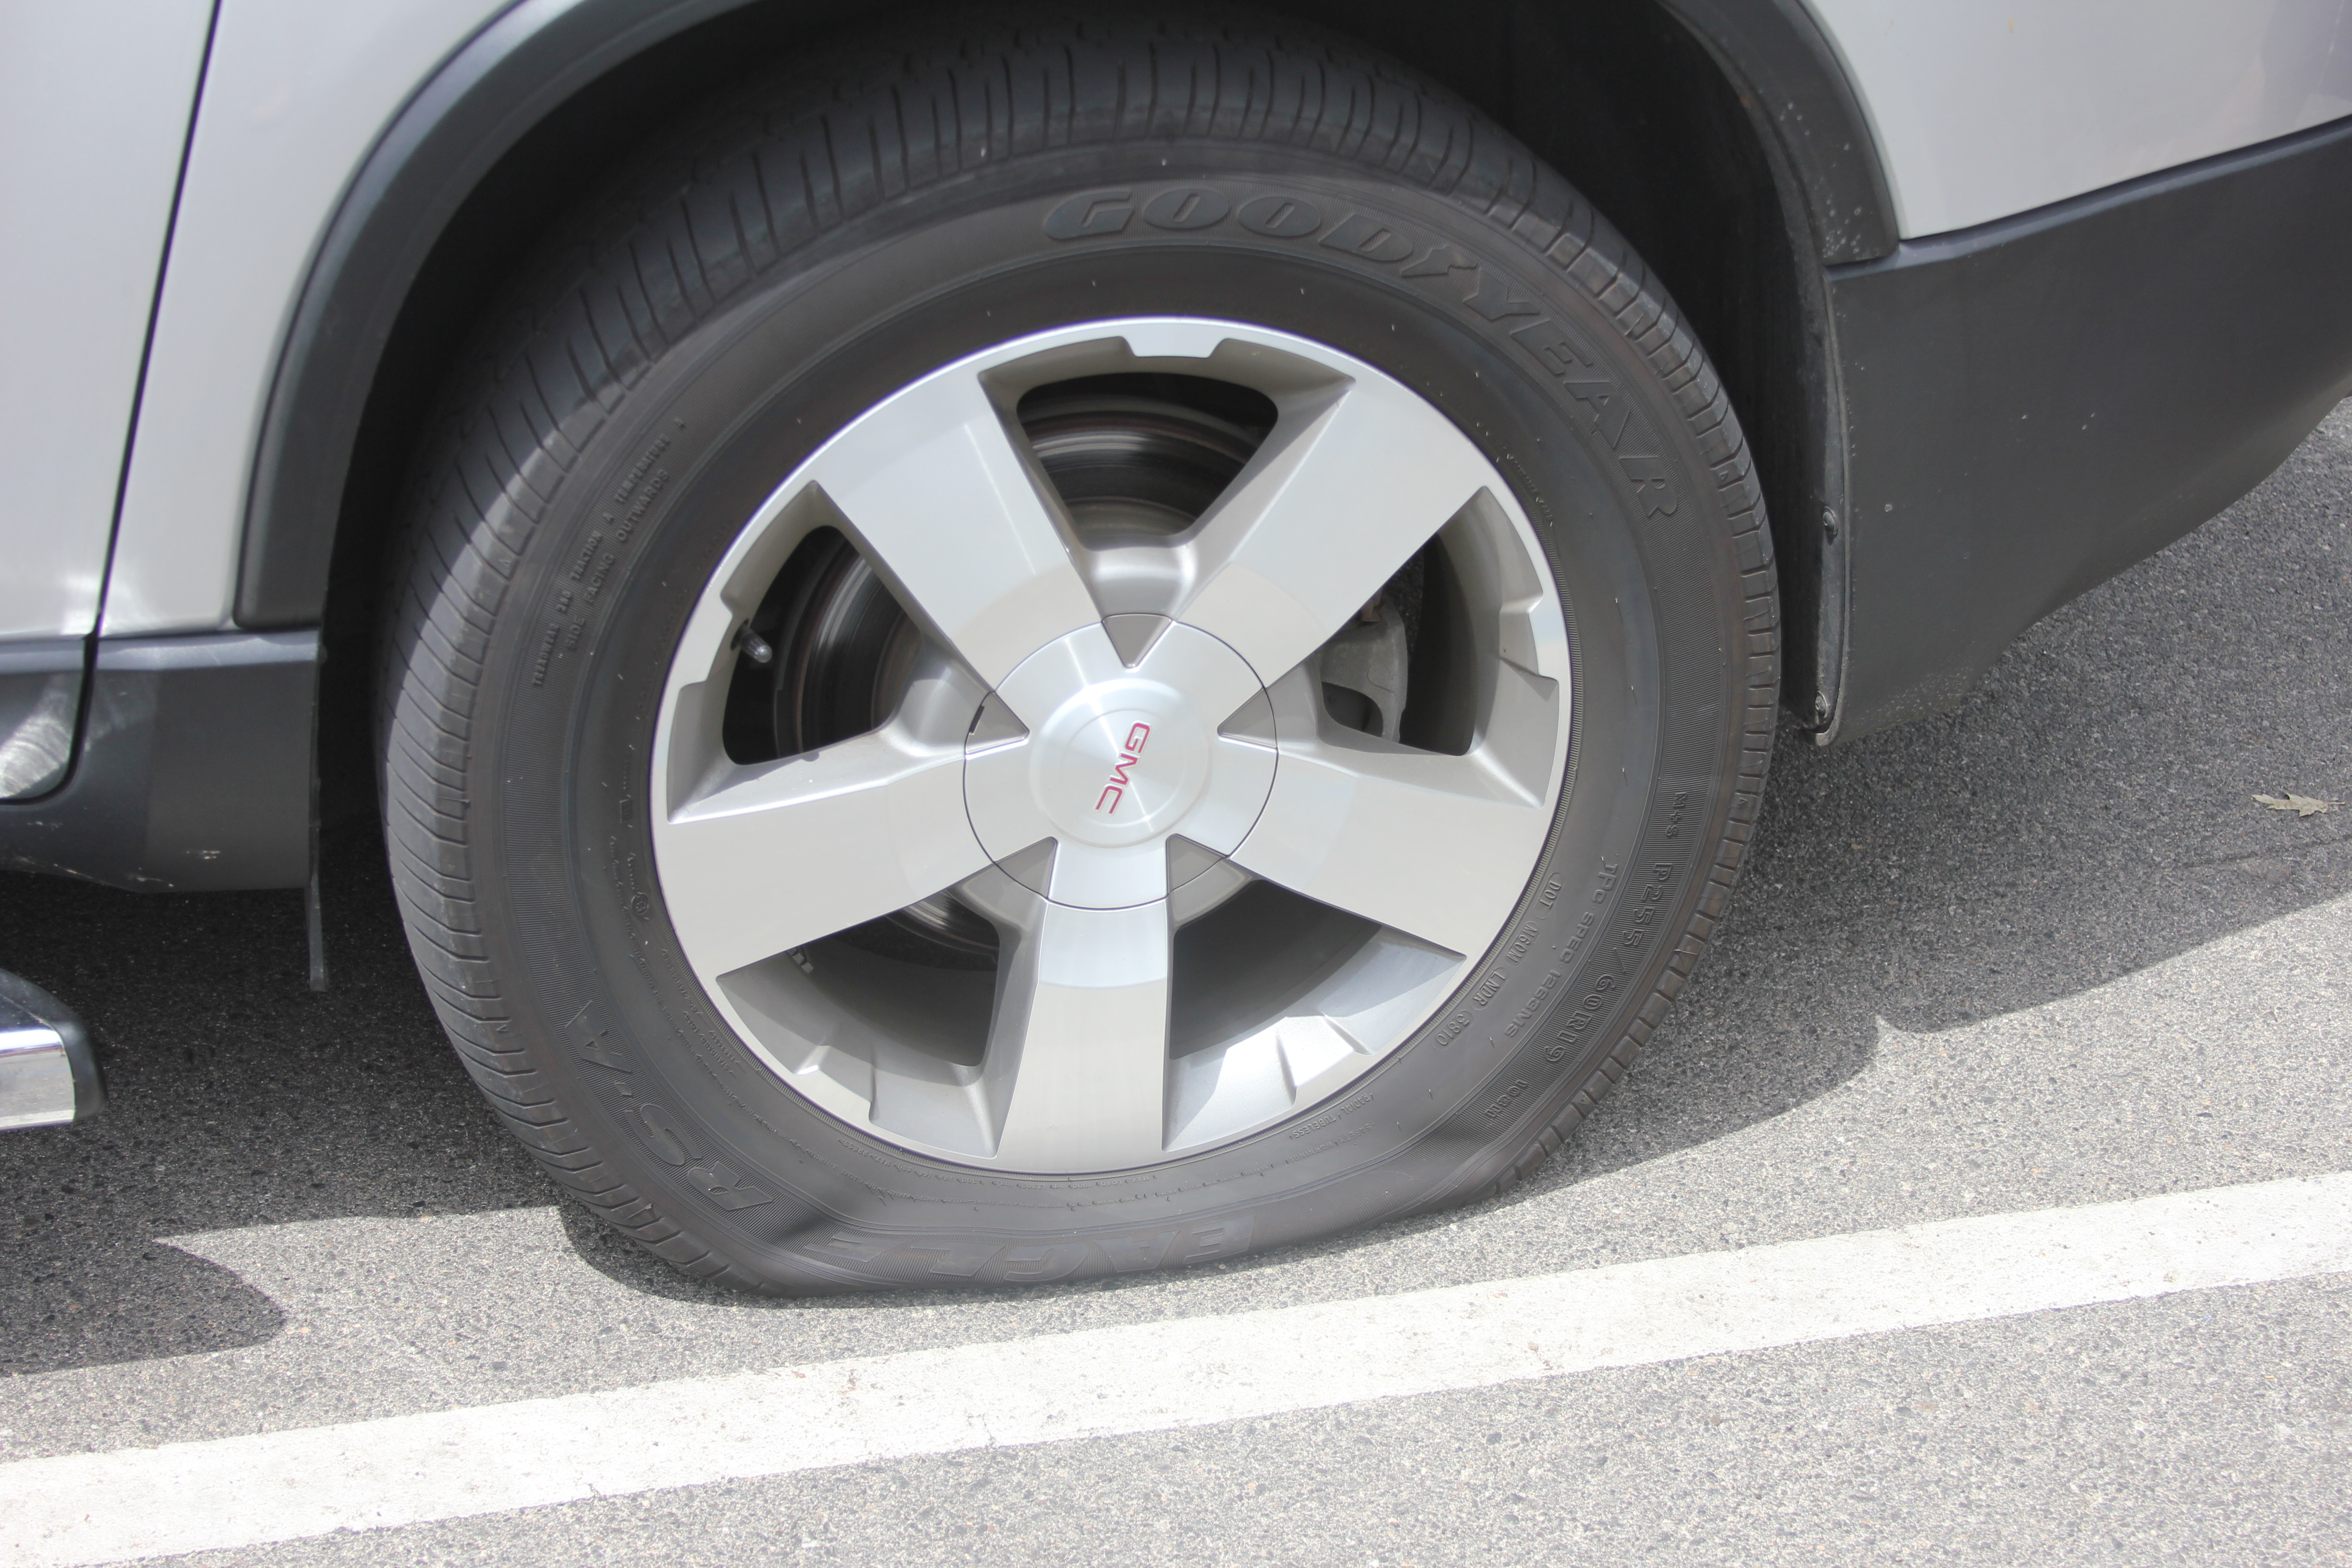
If your tire looks like this, fuel efficiency maybe isn't your top concern.

However, you can easily counter the effect of temperature on your tire pressure by simply adding a bit of air in the winter. 

A related source of rolling resistance comes from the road itself. The road surface deforms slightly under the pressure from the wheels of your car. Because of that deformation, your wheels are actually always moving out of a small depression as you drive, and so the road is a source of rolling resistance.

The contact surface for a rigid wheel on a deformable road. 

Hard, stiff road surfaces like concrete don't offer as much resistance as say gravel or your neighbour's lawn, but there's still some resistance there. Snow and slush on the roads increases rolling resistance to some extent, contributing to further reductions in winter fuel economy.

Aerodynamic drag also contributes to rolling resistance because a layer of air close to the tire has to be dragged around the wheel as it turns. As described in the previous section, drag increases because air density increases as temperature decreases. Therefore, the rolling resistance contributed by aerodynamic drag also increases as the temperature drops in the winter.

Finally, slippage contributes to the total energy losses from rolling. Even on clean, dry roads, your tires experience a bit of slippage as you drive. The applied torque required at the drive wheels to maintain a certain speed increases as slippage increases, wasting energy. Obviously slippage gets worse in winter conditions when roads are wet, snowy, or icy. All of those extra moments where you're spinning the wheels without going anywhere start to add up to a bit of lost fuel economy.

Or maybe a lot of lost fuel economy.

To summarize this section, rolling resistance comes from three main sources: hysteresis, aerodynamic drag, and slippage. Winter conditions tend to increase losses from all three of these sources.

Idling
People idle their cars more in the winter. When it's really cold, people often start their cars and let them run for several minutes to allow the interior to heat up. They also are less likely to shut the car off if they have to wait somewhere briefly (for example, when picking the kids up from school) because they don't want to get cold waiting in the car. For all that extra time your car is idling you're getting 0 miles per gallon.

Lubricant Viscosity
All of the oils and greases keeping your car's various moving parts moving smoothly become more viscous as the temperature drops. Engine oil, transmission fluid, differential fluid (if you've got a rear-wheel or all-wheel drive vehicle), etc. The more viscous the fluid is, the higher the fluid shear resistance. Which is really just a fancy way of saying it gets harder move things through the fluid. So when the automotive fluids are cold, your engine has to work harder to get all the parts moving, and that means more fuel consumption. You can partially counter the effect by switching to synthetic engine oil, or using a lower viscosity oil in winter (switching to 5W-30 instead of 10W-30 for example, as long as it's still okay for your engine).

A typical grade recommendation chart. Make sure you consult the grade recommendation chart or table for your particular vehicle before switching oils. Check your owner's manual or look it up online.

Higher Electrical Loads
Your car's cabin heater and blower fan require electricity to run. Ultimately, that electricity is produced by burning gasoline. So keeping your car all toasty warm on a cold day takes extra energy, and extra fuel. And that's not the only extra load. You've got the rear defroster, the windshield wipers, and the washer fluid pump too. Perhaps you've got some other fancy doodads, like heated mirrors, heated seats, and heated steering wheel. All the extra stuff you use exclusively (or at least more often) in the winter contributes to your reduced fuel economy.

Lower Engine Temperature
Your engine doesn't run very efficiently when it's cold. And the colder it is outside, the longer it takes for your engine to warm up. This doesn't mean you should let your car idle for 5-10 minutes before you head to work in the winter. Idling wastes more fuel than your cold engine does. Even on really cold days, your engine will be sufficiently warm after just 2 minutes of idling. It is recommended that you only idle for 30 seconds and then drive gently for the next 2 minutes in order to warm up the engine. Driving will warm the engine faster than idling. But even if you're not idling excessively, the cold starting temperature means your average fuel efficiency for a given trip will be lower in the winter. The effect is more pronounced for short trips because the engine is cold for a larger proportion of the total trip. You can counter this problem by parking in a garage or using an engine block heater. Research performed in Canada has shown that for short, simulated trips in an urban setting, using an engine block heater improved fuel efficiency (relative to not using one) by up to 10% at -20 °C and 25% at -25 °C.

Lower Operating Speed
When road conditions start to get slippery due to snow and ice, your available traction for stopping and cornering is reduced. Most drivers are at least competent enough to be cognizant of how ice will adversely affect their safety. Hence, they will slow down to compensate for the reduced traction. A car's optimal speed varies from model to model due to many different factors. However, broadly speaking, a car's fuel efficiency is at or reasonably close to optimum when driven at a steady speed within the range of 50 to 90 km/hr (31 to 56 mph) . As you start to deviate from that range, fuel efficiency typically drops off rapidly. So when the snow flies and you're driving only 35 km/hr because you don't much care for car accidents, your fuel efficiency takes a hit.

Winter Fuel
For reasons partly related to safety and partly related to engine operation, gasoline manufacturers sell a different blend of chemicals as gasoline in the winter than in the summer. Gasoline has to be readily vaporized in order to power the engine, but vapor trapped in the fuel delivery system can cause stalling and difficulty starting (known as vapor lock). Accordingly, manufacturers manipulate the gasoline's Reid Vapor Pressure (RVP, a measure of volatility) by changing certain additives, making it more volatile in the winter so that your car will still run in the winter. Common winter additives are ethanol and butane. While this improves the volatility of the fuel, it also decreases the ethalpy of combustion of the fuel because both butane and ethanol have lower energy content than octane (the main ingredient in gasoline). The overall effect of the winter fuel additives is approximately 1 to 3% reduction in fuel economy.

Summary
There are many factors that contribute to a reduction in fuel economy in winter, including:
  • Cold temperatures increase aerodynamic drag on the car.
  • Cold temperatures increase hysteresis losses in tires, increasing rolling resistance.
  • Cold temperatures reduce tire pressure, increasing rolling resistance.
  • Cold temperatures increase aerodynamic drag on the tires, increasing rolling resistance.
  • Slush, snow, and ice increase tire slippage.
  • Drivers typically idle longer when it's cold.
  • Automotive fluids are more viscous at cold temperatures, effectively increasing the net friction force to be overcome by the engine.
  • Drivers typically run heaters and defrosters in the winter, increasing electrical loads; hence, fuel consumption.
  • Cold engines are less efficient than warm engines.
  • For safety reasons, drivers typically slow down to speeds well below optimum when road conditions are poor.
  • Winter grade fuel contains additives that increase volatility but reduce energy content of the fuel.

While you can't escape all of winter's detrimental effects on your fuel economy, there are a few things you can do to mitigate them:
  • Use winter tires in the winter.
  • Maintain the manufacturer's recommended tire pressure.
  • Don't spin your wheels even faster when you want the car to go but you have poor traction.
  • Keep idling to an absolute minimum.
  • Use manufacturer approved synthetic or lower viscosity lubricants in the winter.
  • Minimize the use of your heaters and defrosters. Particularly if you don't have any passengers, it's generally more economical to just use a seat warmer than the cabin heater.
  • Where possible, avoid short, intermittent trips by combining them into longer trips. 
  • Use an engine block heater. To minimize your electricity usage, use a timer or only plug it in when necessary. Two hours is enough time for the block heater to do its job.
  • Park inside a garage when possible.

Additional References
Clark, S. K. and Dodge, R. N. (1979). A Handbook for the Rolling Resistance of Pneumatic Tires.
Wong, J. Y. (2001). Theory of Ground Vehicles, 3rd ed.
Fueleconomy.gov

Sunday 10 August 2014

Differential Equations, Summation Series, and Washing Dishes

Suppose you have a glass full of some liquid that you need to get rid of and rinse out so that you can safely drink from the glass again. It doesn't really matter what the stuff is for this analysis, as long as it mixes with water (vinegar, bleach, spoiled milk, soapy water, whatever). We'll call this stuff the “pollutant”. You probably know from experience that it takes a lot of water to get rid of the pollutant if you simply run the tap and let the glass overflow until it's clean (we'll call this the "overflow method"). It's way more efficient to dump the stuff out and rinse the glass, repeating as necessary (we'll call this the "rinse-repeat method"). If you don't believe me, go try it out. Fill a glass with milk or coffee and then run the tap and see how long it takes before the glass is full of clear water. 

An overflowing glass. Enjoy this picture because there's a lot of math coming up.

Notation


Overflow Method

We know qualitatively that the rinse-repeat method is a much more efficient use of water, but in this post we'll actually quantify the difference. Let's start by analyzing the overflow method. The glass initially has some quantity of pollutant in it, P. If you run the tap and overflow the glass, how much water do you need to reduce the amount of pollutant in the glass to some suitably low value? For instance, if you had a glass full of soapy water, how much water would you need to use to remove 99.9% of the soap from the glass? The problem can be modeled with a first-order differential equation.

Let’s describe the problem in words first. The rate of change in the quantity of pollutant in the glass is equal to the rate of pollutant coming in (in this case zero because we assume pure water is being added) minus the rate of pollutant going out (the concentration of pollutant in the glass multiplied by the flow rate of liquid leaving the glass, q). If we assume perfect mixing, the concentration of pollutant in the glass at any moment in time is equal to the quantity of pollutant in the glass, P, divided by the volume of the glass, VG. Mathematically, the problem can be expressed as:
  
Equation 1


This is a first-order differential equation because the rate of change of P is a linear function of P. The solution to this one is simple as far as differential equations go, and looks something like this:

Solution to Equation 1

If we divide by P we have an expression for the proportion of pollutant remaining in the glass:

Equation 2

We can specify some value of pollutant remaining (say 0.1%) and solve for the amount of time it will take to get there:

Rearranging Equation 2 to solve for time t

But we’re looking for the amount of water we’re using, not how long it’ll take. The volume of water that spilled out of the glass is simply equal to tf multiplied by the flow rate q. If the glass wasn't completely full of pollutant to start with, then there is also some amount of water required to reach the onset of overflowing, equal to the difference between VG and P0. Therefore,

Equation 3

If we divide by the volume of the glass and replace P0/VG with the initial concentration α0, we get a general expression that will tell us how much water is needed (in multiples of the volume of the glass) to remove the pollutant by the overflow method until you've reached some reduced level Pf/P0.

Equation 4
Dilution water required when using the overflow method to remove a pollutant.

Plotting Equation 4 gives this graph:

Normalized volume of dilution water required to reduce pollutant levels to some threshold Pf/P0

I used a logarithmic scale for the horizontal axis because it makes a nice linear plot. What the plot shows is that to remove 99.9% of the original quantity of pollutant in the glass (Pf/P0 = 1/1000) using the overflow method, you need to run the tap and use an amount of water equal to at least 7 times the volume of the glass. 

To give a simple example, suppose your favourite mug (assume 350 mL volume) is half full of old coffee that you want to get rid of. If you just run the tap to make the mug overflow until the mug's clean, how much water would you be using? To remove 99.9% of the 175 mL of old coffee (i.e. 0.175 mL left in the mug), you would have to use almost 2,600 mL of water. 

Rinse-Repeat Method

Now for the rinse-repeat method. Let’s assume that after dumping out the contents of the glass there is some residual volume left Vresid, which can also be expressed as some proportion of VG, i.e.:

Residual volume in the glass after dumping the contents

Let’s also assume that after dumping the contents, you add some pure water to rinse out the glass, again some proportion of VG:

Volume of rinse water per rinse cycle

If we start with some volume of pollutant P0, upon dumping the contents the first time, before any rinsing is done, there is ρVG pollutant remaining in the glass. Then ηVG is added, diluting the residual pollutant to a concentration of:

Concentration of pollutant in glass after first rinse cycle

After dumping that diluted liquid out from the first rinse, you’re left with some residual pollutant in the glass, equal to:
Residual pollutant after one rinse cycle

Repeating the cycle a 2nd and 3rd time would leave residual amounts of pollutants equal to:

Residual pollutant after two and three rinse cycles

In general, the residual pollutant after emptying the glass after rinsing for the Nth time is:

Equation 5
Residual pollutant after N rinse cycles

The summation term isn't convenient to work with, but luckily there is a closed form solution to this sum and we can express Equation 5 as:

Equation 6
Alternate expression for the residual pollutant after N rinse cycles

Now we’re interested in reducing the amount of pollutant to some threshold level of Pf/P0. Equating Pf  to Equation 6 and then rearranging:

Equation 7
Proportion of pollutant remaining after N rinse cycles

Solving Equation 7 for N is a little tricky, but it can be done. We get:

Equation 8
Number of rinse cycles
N necessary to reduce pollutant levels to some threshold Pf/P0

We also could have made a useful approximation to make it easier to solve for N. Since ρ is probably much smaller than η, we can approximate Equation 7 with the following:

Useful approximation of Equation 7 when ρ << η

Which is accurate to within 10% for ρ/η < 1/10. Solving for N from the approximate expression:

Approximation of the number of rinse cycles N necessary to reduce pollutant levels to some threshold Pf/P0

Based on how we've defined the problem, N technically has to be an integer, but we can ignore that detail for the purpose of estimating the amount of dilution water required. If we rinse N times, the total amount of water used to remove the pollutant is simply:

Dilution water required to remove the pollutant using the rinse-repeat method

Normalizing as before, we get Equation 9:

Equation 9
Dilution water required to 
reduce pollutant levels to some threshold Pf/Pusing the rinse-repeat method

After all that math, what do we have (besides a headache)? Well we can make a graph like we did for the overflow method, shown below:


It's clear from these plots that the rinse-repeat method is far more efficient at removing the pollutant. To illustrate, let's go back to the example of the 350 mL mug initially containing 175 mL of old coffee. Assuming ρ = 0.01 and η = 0.5, after just one cycle we've removed almost 99.99% of the pollutant. That's only 175 mL of dilution water and we already have an order of magnitude improvement in pollutant removal compared to the overflow method using almost 15 times as much water. This chart below shows just how much of a difference there is between the two methods:

Comparison of the two pollutant removal methods. 

The overflow method requires about 12 times more water to remove 99.9999% of the stale coffee in our example. If we go to a completely unreasonable level of pollutant removal, beyond even the dilution scale of homeopathic "medicine" preparations, the overflow method still wastes way more water. You can see for yourself in this table below:

Comparison of the overflow and rinse-repeat methods for the coffee mug example.

Of course, at extreme dilution levels, we eventually get down to the situation where it becomes statistically unlikely that a single molecule of the original substance is left, so at these levels my equations don't actually make meaningful predictions. But it still effectively illustrates that there is no situation where the overflow method is a more efficient use of water. It doesn't even come close.

In conclusion, overflowing a cup or bowl to clean it is absurdly wasteful of water. You already knew that, but now you've seen the math to back it up.