Showing posts with label science literacy. Show all posts

Monday, 28 September 2015

Contraceptive Efficacy and Combined Probability

When sex education sources quote numbers on the efficacy of different forms of contraception, they usually report a number like "98% effective". What they really mean is that, on average, 98 out of 100 women using that method of birth control for a whole year won't get pregnant. However, most people don't understand how a seemingly small annual risk of pregnancy might translate to a significant risk of pregnancy over a period of several years. In this post I show you how the probability of pregnancy grows over time and why it's commonly recommended that couples use two forms of contraception.

The annual risk of unintended pregnancy for several different contraceptive methods are given in the table below, taken from the 20th edition of Contraceptive Technology. The effectiveness typically reported by sex education sources is simply 100% minus the annual risk of pregnancy.

I'm not sure how typical use differs from perfect use when it comes to male sterilization...

It should be noted that "typical use" is perhaps misleading because it is an average for the people reportedly using that contraceptive method. For most contraceptive methods, including the condom and the pill, the most common deviation from "perfect use" is conscious user non-compliance (i.e. knowingly not using the contraception). Not using the contraception shouldn't really count in the typical use, but I guess they just do the best they can with the data they get.

So, suppose you're interested in calculating the risk of pregnancy within a period several years. From the table above, we can get the probability of not conceiving during the first year of use, equal to 100% minus the number from the table. We'll call this number p. The probability of not conceiving during a period of n years of use can be taken as p raised to the nth power. The risk of pregnancy is then calculated as


This simply estimates the risk of getting pregnant at least once during an n-year period while using a certain contraceptive method. The graph below compares a few common contraceptive methods for n = 1 to 10 years.

Comparing the risk of pregnancy using different contraceptive methods.

The graph shows that if you are not diligent in using the contraceptive method properly (i.e. you stray from "perfect use"), there's a pretty good chance of unintended pregnancy somewhere down the road. There's greater than 50% chance of unintended pregnancy within 8 years of "typical use" with the pill, within 6 years with the Standard Days method, 4 years with the male condom, and 3 years with the withdrawal method. Even with perfect use, if condoms are the only contraceptive method used, there's still about 18.3% chance of an unintended pregnancy in 10 years. That's 1 in 5.47. If you look at a 10-year period, comparing all the methods from the previous table, you'll find that if you use only a single method, only sterilization or IUDs reduce your risk of unintended pregnancy to less than 1 in 2 (i.e. less than 50%), assuming "typical use".


We can estimate the risk of pregnancy when contraceptive methods are combined by combining probabilities as shown in the following equation:


When two events, A and B, are independent, the probability of both A and B occurring is equal to the product of the probability of A and the probability of B. Applied to pregnancy risk, it means the risk of getting pregnant while using both methods A and B is equal to the probability of A failing multiplied by the probability of B failing. This approach to combining probability assumes that the individual probabilities are independent of each other. Before combining probabilities you should think about whether they actually are reasonably independent. For example, birth control pills and male condoms are probably independent (or nearly independent) because they are unrelated methods and it is unlikely that one method will influence the efficacy of the other. Therefore, the probability of an unintended pregnancy in the first year of use is probably approximately 0.18*0.09 = 1.62% when both male condoms and birth control pills are used (assuming "typical use"). A counterexample is the combination of the Standard Days Method and the TwoDay Method, which are probably not independent because they are both methods of achieving "fertility awareness". It's unlikely that one method negatively influences the other, but combining the two probably has little benefit either. The combination of Standard Days Method with the TwoDay Method is probably only slightly better than either one of them their own. That said, I've calculated the risk of pregnancy with some combinations of contraceptive methods which probably satisfy the assumption of independence in order to demonstrate how using two methods simultaneously dramatically reduces your risk of unplanned pregnancy.


Comparing the risk of pregnancy using different combinations of contraceptive methods.

As you can see, combining contraceptive methods reduces the risk of unintended pregnancy by a pretty significant margin. If using a single contraceptive method, assuming "typical use", only IUDs or sterilization were effective enough to reduce the risk of unintended pregnancy to less than 50% in 10 years. Combining 2 methods very effectively reduces the risk of unintended pregnancy without resorting to invasive or irreversible medical procedures.

Friday, 7 August 2015

Welding, Brazing, and Soldering

Welding, brazing, and soldering are all methods of joining two pieces of metal together, but how do these techniques differ?

Welding involves the use of high temperatures or pressures to cause metals of two distinct parts to coalesce at the joint. A well-executed weld is at least as strong as the surrounding base metal. However, weld processes that are improperly carried out can negatively affect the base metal near the weld site and produce weaker welds. In fusion welding, some of the base metal is melted, often with a filler metal deposited to the pool of molten metal during the process. Fusion welding processes include torch welding, arc welding (comprising several variations, such as SMAW, GMAW, FCAW, and SAW), laser beam welding, and electron beam welding. Fusion welding processes require that the parts be of similar composition. For instance, you can't join copper or aluminum to steel using fusion welding. In solid-state welding, the base metal is not melted and no filler metal is added.  Solid-state welding processes include the original welding process, forge welding, as well as several modern techniques, such as magnetic pulse welding, explosion welding, and friction-stir welding. Solid-state welding is much more suitable for joining dissimilar metals than fusion welding.

Simple explanation of the explosion welding process.

Brazing bonds two pieces of metal together with a braze alloy that serves as a filler metal in the joint. The braze alloy is melted during the process and bonds the parts together when it cools. Unlike welding, the base metal of the two parts is not melted or otherwise made to coalesce. Thus, braze alloys must have a lower melting temperature than the parts being joined. Brazing can be used to join different metals together, like aluminum, copper, gold, and nickel. Properly brazed joints can be very strong, though generally not as strong as welded joints.

Video showing a copper pipe being joined to a stainless steel pipe by brazing.

Soldering is similar to brazing, but is performed at lower temperatures. The filler metal used in soldering is known as a solder. The American Welding Society has defined 450 °C (840 °F) as the line between soldering and brazing (below 450 °C is soldering, above 450 °C is brazing). Solders in the past often contained lead, but these have since been mostly replaced with lead-free alternatives due to environmental and health concerns. Soldered joints are not as strong as brazed or welded joints.

Video on how to solder copper plumbing.

In summary, welded joints are strongest and typically require the most heat (except for fancy welding techniques that rely on high pressure). Metal from both parts coalesce at the welded joint. Brazing requires less heat than welding and brazed joints are not as strong as welded joints. Parts are joined together with a filler metal that melts at a lower temperature than the base metal. Soldering is essentially the same as brazing, except soldering is performed using filler metals with melting points below 450 °C and soldered joints aren't as strong.

Saturday, 4 April 2015

Understanding Return Periods

When discussing extreme events like floods, earthquakes, heavy snow, or strong winds, people often refer to a return period (also known as a recurrence interval). The “100 year flood” or the “30 year wind” for example. The 2010 National Building Code of Canada prescribes how loads on buildings should be calculated. The starting points for wind and snow load calculations are based on 50 year return periods. Discussing extreme events in terms of the return period is a convenient way for engineers and scientists to think about the statistical likelihood of these events. However, it’s also easy to misinterpret what a return period really means.

The terms “return period” and “recurrence interval” are confusing because they are not real durations of time. In other words, the return period is not the amount of time that should elapse between similar events. The return period is really an estimate of the likelihood of an event’s occurrence.

Let’s take a 30 year snow load as an example. The 30 year snow load is not an event that repeats regularly, every 30 years like clockwork. Snow loading is random, so there’s no reason to expect big snow loads to recur at a regular interval. If you could look at many years of data, you’d probably find a few clusters of big snow loads and long periods with comparatively low snow loads. But you should find that, overall, the 30 year snow load occurs in only about 3.3% (1/30) of the years in total.


There are few places in the world where this wouldn't be considered a very rare snow load. (Source: Snow-Blow.com)

Another confusing aspect of the return period is that these all sound like rare events, but then we hear about them all the time on the news. Are return periods being exaggerated?

The big issue here is that a return period is limited to a specific area where the statistical data is valid. The 100 year flood they’re talking about applies only to a particular area along a particular river. At a specific location, the 100 year flood is rare. But between all the rivers in the world, it’s actually pretty likely that a 100 year flood will take place somewhere in any given year.

Another issue is that the assumptions that went into estimating a return period might be wrong. There’s no guarantee that future conditions won’t change, affecting the likelihood of the event. For example, if a new town pops up and it discharges some of its storm sewers into the river, the characteristics of that river have changed. If it’s a small river and a big town, the river’s new 100 year flood level could be significantly higher than it was before.


An area of Morningside Creek in Toronto, ON at normal flow. (Source: Geocaching.com)

This is what happens to Morningside Creek when it gets a sudden influx of stormwater from the outfalls.
(Source: Friends of the Rouge Watershed)

Rouge Park, Meadowvale Road, Scarborough, ON
An area of Morningside Creek where the damage caused by stormwater outfalls is quite apparent. Regular flooding from stormwater outfalls added in the relatively recent past has caused rapid erosion of the banks. Mature trees have toppled into the river as its new floodplain gets carved into the earth. (Source: E. Victor C.)

To summarize, return periods are not real durations of time. They are just a different way to describe the probability of extreme events such as floods and snow loads. Return periods are calculated for specific areas using historical data. Hence, extreme events are rare for specific locations, but it is fairly likely that one will occur somewhere in the world in any given year. Furthermore, factors influencing some extreme events can change over time. Therefore, return periods estimated from past events don’t always accurately reflect the probability of future events.

References
Benjamin, J. R. and Cornell, C. A. (1970). Probability, Statistics and Decision for Civil Engineers. McGraw-Hill, New York, NY.
Mays, L. M. (2005). Water Resources Engineering. John Wiley & Sons, New York, NY.
NRCC. (2010). National Building Code of Canada 2010. National Research Council of Canada, Ottawa, ON.


Sunday, 13 July 2014

Will Women Outrun Men?

In 1992, Drs. Brian Whipp and Susan Ward of the University of California published an article in the journal Nature claiming that women would be beating the men at the marathon at the world elite level as early as 1998. In fact, they claimed that women will be outrunning the men in all the events by the middle of the 21st century. Needless to say, their predictions were bad. But that didn't discourage Tatem et al, a group of doctors from the University of Oxford, from publishing their own article in Nature in 2004. Tatem et al. essentially repeated the same analysis, and arrived at essentially the same conclusion, as Whipp and Ward. Tatem et al focused on the 100 m dash though and had a few more years worth of data to work with. However, they still concluded that women will beat men in the 100 m event at the 2156 Olympics.

Tika Gelana won the 2012 Olympic marathon in Olympic record time, but still 15 minutes behind the winner of the men's event. She would have placed 64th in the men's race.

It's now 2014 and a woman has yet to beat all of the men at any event at any world-class track & field meet. Twenty-two years after the blunderous predictions of Whipp and Ward and women still aren't threatening to break any of the men's world records any time soon. So how exactly did these doctors arrive at such bad conclusions? They were guilty of a gross misuse of statistics. How did bad statistics get published in Nature in 1992? I don't know. My guess is that the authors lucked out and got a peer reviewer who also knew nothing about statistics. How did essentially the same argument get published in Nature again in 2004? I wish I knew that too. It was a "double fail" for Nature's peer review process.

Anyway, I'm going to walk you through how to analyze world record progressions just like Tatem et al and Whipp & Ward, then provide some reasoning to demonstrate how ridiculous those authors' conclusions were.

Step 1: 
Obtain the historical progression of world records from today to as far back as you can go. Whipp & Ward used records from the early 1900s up to 1992 (the IAAF started keeping records in 1912). Tatem et al used 1912 to 2004. I'll go from as far back as I can find data for, though arguments can be made for ignoring data prior to 1912. The main one is that the IAAF hadn't yet formed and therefore older records are not ratified as world records. A weaker argument is that Excel doesn't recognize dates from before the year 1900. That problem is easily overcome though, you just have to get a little creative with how you plot the dates.

By the way, finding the data for this analysis was harder to do back when our learned doctors were drafting papers for Nature, but today we have Wikipedia and all the world record progressions (at least the ratified records anyway) are found with ease. For example, here's the men's 100 m record progression. I gathered my data from here, which includes many non-ratified records. I've cross-checked some of the results to verify accuracy using this extensive database of track results.

Step 2:
Plot the record progression on a graph in Excel. Plot either the result or the average velocity on the y-axis and the date the record was set on the x-axis. Do this for both men's and women's records. I've plotted the 100 m and marathon world record progressions below:

Normalized world record progression for the 100 m dash and marathon.

Step 3:
Use the "Add trendline" feature in Excel to add best fit lines to the men's and women's records. Here's my plot again, but with the trendlines added:

Normalized world record progression with trendline forecasting for the 100 m dash and marathon.

Step 4:
Extrapolate the best-fit lines and calculate the date when the men's line intersects the women's line. Boldly conclude that women will be beating men at the Olympics by the date you've calculated. I've calculated the intersections of all my trendlines and generated the table below:

Predicted dates for intersection of men's and women's world records.

Step 5:
Write up your findings in a short article and submit it for publication in Nature.

Here is a list of conclusions you can pretend are supported by the data:
  1. The 5000 m world record will be the last of the men's records to fall to the women. It probably won't happen until 2178.
  2. Women's records will exceed the men's records in eleven of the thirteen events by the year 2050.
  3. We are 20 years overdue for the intersection of the men's and women's records in sprint hurdles, based on average speed to complete the event (the sprint hurdles are 100 m for women and 110 m for men). 
  4. We are 10 years overdue for the intersection of the men's and women's records in the 10,000 m. 
  5. We are 8 years overdue for the intersection of the men's and women's records in the 4x400 m relay.
So, there you have it. Writing a paper for Nature can be just that easy. But you've probably already realized that something's amiss. Let's look at a few reasons why this kind of "analysis" is completely irrational.

Reason #1:  The models predict that marathon runners will eventually run faster than sprinters.

If you look at the slopes of the best-fit lines for each record progression, you'll find that most of the long distance events have steeper slopes than the sprint events. This suggests that the marathon record will eventually represent a higher average speed than the 100 m world record. I guess the marathoners will be content to use their incredible speed and super stamina only to win marathons, leaving the 100 m event to slower, less capable humans. Here are all the slopes of the lines:

Average rate of improvement in world record performances, expressed in metres per second per year.

The women's 3000 m steeplechase record has the fastest rate of improvement, suggesting that a woman running nearly two miles and over several 30-inch high barriers will one day be the fastest human on the planet. The men's 100 m record has the lowest rate of improvement, suggesting that the men's 100 m record holders will eventually have the slowest average speed of all male and female record holders in any track event. Below are all the dates of intersection with the men's 100 m world record progression:


As you can see, in most of the events, our models predict that a woman will be outpacing the men's 100 m world record holder by the year 2100. The men running in other events will also outpace the men's 100 m world record, but it will take them, on average, 100 years longer to do it than the women.

Reason #2:  A linear model to predict how fast the world's fastest human can run at a given time makes no physical sense and has no basis in reality.

Why does a linear model not make sense? Well, to start, a linear model has a zero-intercept. Meaning that the model suggests there was a time in history where the world's fastest human was stationary. If you go further back in time, the model predicts negative speeds. Speed is considered to be an absolute quantity, so negative speed has no physical meaning. A linear model also increases without bound; it suggests that there is no upper limit to how fast a human can run. Obviously, that cannot be true. The speed of light is definitely beyond reach, but a linear model suggests that we'd get there (eventually). Of course, there are more stringent restrictions related to our biology and physiology that cap human speed to far more modest levels, but we needn't get into that. The point is there are obvious limits to how fast we can run and a linear model ignores them. So here are some important and completely absurd milestones predicted for the women's 3000 m steeplechase record:


Reason #3:  A model with no physical basis cannot be trusted to give meaningful results if you extrapolate beyond the data.

The average extrapolation to intersection of the trendlines was 32 years for the men and 42 years for the women. That's quite significant. The men's records often went back to the late 1800s, but the women's records rarely went back to around the 1920s. Several of the women's records only go back to around the 1970s. In the case of the 3000 m steeplechase, the records only go back to 1996 because the IAAF didn't permit women to compete at that event previously.

How far you have to extrapolate the trendlines to reach a predicted win for women over men.

Extrapolating so far beyond your data is not a meaningful prediction. All it can tell you is what might be if the general trend you see now just happens to continue in exactly the same way long into the future.

Reason #4:  In the past, female steroid users could get away with more significant performance enhancement than male steroid users.

Drug testing in the 1970s and 1980s wasn't nearly as sensitive as it is today. Steroid use was rampant and often went undetected. Several communist countries had state sponsored programs to enhance athletic performance (often without the athlete's knowledge or consent). East Germany and the Soviet Union were quite successful at it. This isn't to say they were the only cheaters, but they definitely had spent considerable effort researching the best way to cheat. Many American and Chinese athletes were also cheating.

The reason steroid use is comparatively advantageous for females has to do with our biology. Anabolic steroids mimic the hormones that make men strong and muscular. Women have these hormones too, but in much smaller quantities (typically less than 10% of male levels). What this means is that for the same quantity of anabolic steroid, women will have a much higher increase in their relative hormone levels, and therefore experience comparatively greater enhancement of their athletic performance. I've depicted this graphically below:

Graphical comparison of an equal dose of steroids in men and women.

What I've done is assumed that a male athlete typically has 100 units of testosterone naturally and a female athlete typically has one tenth that amount. I have then shown the effects of adding 10 units from steroids. In the male athlete, it's a 10% increase in his normal testosterone level. In the female athlete, it's a 100% increase in her normal testosterone level.

What does all this talk of steroid use mean? Well, it means that a level of steroid use too small to detect in 1980 could potentially still provide significant performance enhancement to female athletes. That might help explain why women's records are so much older than men's records: the women's records have been set almost impossibly high by the steroid-fed women of the 70s and 80s. Looking only at official Olympic running events, the average age of a men's world record is currently 8.8 years. The average age of a women's world record is more than twice that at 18.5 years.

Dates the current world records were set.

Women simply aren't breaking records like they used to, but our prediction models don't know that.

Reason #5: Historically, fewer women have been able to train and compete in athletics. This strongly influences the slope of the best-fit line.

Many of the women's races didn't appear as Olympic events until long after the first modern Olympiad in 1896. Therefore, the men have a longer history of world-class competition in these events. Here's a list showing when each event first appeared at the Olympic games:


Furthermore, men were competing in some of these events and maintaining statistics long before the first Olympics, so the world records were well-established. Women in the past haven't pursued athletic endeavours due to various gender-biases and ill-conceived notions of female physical limitations. For instance, after six women collapsed upon completing the 800 m race at the 1928 Olympics, it became widely believed that this event was simply too much for feminine strength. Some doctors warned that women who participated in such feats of endurance would grow old too quickly. It didn't seem to occur to everyone that these women simply hadn't trained for this event and that's why it was so hard for them. So up until around the first half of the 20th century, very few women even had the opportunity to pursue athletics and many of the women's records were just beginning to be tracked by the IAAF. Therefore, the initial women's records improved quite rapidly, since they were set by athletes who were comparatively not as well trained as male athletes at the time, in competition against a comparatively smaller pool of talent. This rapid progression early in the data set will inflate the predicted average rate of progression (i.e. increase the slope of the best-fit line). To show you what I mean, here are the women's 100 m and marathon world record progressions again, but split up to show how much faster the records were improving at the beginning.

Women's record progression in the 100 m and marathon.

As you can see, for both events, the rate of improvement in the world record decreases in the latter half of the record progression.

To summarize, two papers prepared by medical doctors and published in Nature suggested that women would soon outpace men in world-class athletics events. The authors (and reviewers) demonstrated poor understanding of the subject matter and did not appreciate the limitations of the analytical methods used to arrive at their conclusions. As a result, their predictions were wildly inaccurate. The moral of the story is: don't conduct an analysis that you're incompetent to perform.

And to answer the question "Will women outrun men?", the answer is "probably not". Men naturally produce more testosterone, hence are larger and stronger, ultimately making them more capable athletes. Even in the marathon, their increased size and strength gives them a bit of an edge.

References

Tatem, A. J., Guerra, C. A., Atkinson, P. M., and Hay, S. I. (2004). Athletics: Momentous sprint at the 2156 Olympics? Nature, 431. pp. 525.

Whipp, B. J. and Ward, S. A. (1992). Will women soon outrun men? Nature, 355. pp 25.

Tuesday, 24 June 2014

Infinite Monkeys and Alphabet Permutations

Given enough time, a chimp punching keys on a typewriter at random will almost surely type out all of Shakespeare's plays.

Of course, the modern chimpanzee would choose a laptop over a typewriter for this task.

This metaphor describes what's known as the "infinite monkey theorem", which basically states that any finite string of characters must be contained within an infinite string of random characters. Here's the proof:

Let's start with looking at the probability of typing a particular finite string of letters on the first try. Let's also ignore all the other keys on a typewriter (or keyboard for those of you who've never seen a typewriter) and consider just the 26 letters of the alphabet. There is a 1 in 26 chance of any particular letter being typed. We are assuming that the letters are selected randomly and independently, so the chance of typing any two particular letters is (1/26) * (1/26) = 1 in 676. Any three particular letters: (1/26)³ = 1 in 17,576. For some number "k" particular letters: 1 in 26 to the k-th power. Now the probability of the inverse situation - not typing a particular letter (or block of letters) - is simply 100% minus the probability of successfully typing a particular letter (or block of letters). I've summarized in the tables below and included notes to help you understand the magnitudes of some of the numbers.


It's clear that randomly typing a short word on the first attempt is extremely unlikely. A complete sentence is practically impossible from our perspective. The chances of typing complete book at random are so exceedingly small that a physical analogy doesn't exist. Let's go off on a bit of tangent to look at some really big and really small numbers in the physical universe. The observable universe is a sphere with a diameter of approximately 92 billion light years, or (to employ some of Mr. Spock's absurd precision) approximately 870,387,203,477,433,600,000,000,000 metres. The Planck length represents the shortest length that, theoretically, could ever possibly be measured. It's approximately equal to 0.000 000 000 000 000 000 000 000 000 000 000 016 161 99 metre. However difficult to fathom the magnitudes of these numbers might be, just keep in mind that I can still fit them on one line in this blog post without resorting to scientific notation. The number representing the chance of successfully typing Hamlet at random on the first attempt contains 55,059 more digits than the play Hamlet does letters. Similarly, the number representing the chance of successfully typing the Bible at random on the first attempt contains 1,467,549 more digits than the Bible does letters. Here are some other really big and really small numbers to show just how small the observable universe is compared to the number of ways you can fail to type a complete work of fiction at random:


Ok, back to proving the infinite monkey theorem. We've calculated the chances of typing a string of k letters on the first attempt. What if we had more monkeys? Let's say there are M monkeys, each with a MacBook Air to type their random strings of letters. The probability of at least one of M monkeys successfully typing a particular string of k letters at random on the first attempt is:


The limit of p as M approaches infinity is 100%:


This means that, given enough monkeys typing randomly, the probability that at least one will successfully type a particular string of k letters on the first attempt approaches 100%. We can also rearrange the equation above to solve for the number of monkeys necessary to ensure a given likelihood that at least one monkey will be successful on the first attempt:


I've calculated how large M has to be to give a certain probability of success by at least one of the monkeys and summarized below.

Number of monkeys required to ensure a given probability of success on the first attempt.

The numbers of monkeys needed to achieve a reasonable probability of success are mindbogglingly large, but they are still finite and calculable.

Ok, we've seen what happens with many monkeys, but we can look at this in a different way. What if instead of many monkeys, we have a single monkey with infinite lifespan, typing randomly and continuously. This problem is a little more interesting and the exact probability is a function of the particular pattern we're looking for. First I'll demonstrate how the probability depends on the particular pattern. Suppose you're playing "Penney's Game" with a fair coin and want to know the chances of getting the sequence HHH or THH in a continuous sequence of tosses. The chance of getting either in the first 3 tosses is equal to 1/2 * 1/2 * 1/2 = 1/8. But as you keep going, the likelihood of THH increases because you have more potential starting points. Let's look at HHH. If you get one H, there's a 50% chance that the next toss is an H, and an equal chance it's a T. Now if you toss a second H, you have a 50% chance of completing the sequence, but if you toss a T, you have to wait at least one more toss to start over with another H. Put another way, if you're trying to get HHH but toss H and then T, you have to toss at least three more times to succeed in getting HHH. When you're after THH, if you toss a T and then another T, you're still potentially only two tosses away from success. In either case, your chance of success approaches 100% as your total number of tosses increases, but THH approaches 100% faster than HHH.


The same situation occurs with our random letters of the alphabet. The probability of finding a certain sequence of letters in a continuous random sequence depends on the sequence that you're looking for. However, the effect is less significant here because there are 26 possible outcomes per keystroke instead of just 2 and the finite string we're really after is thousands of characters long. Consider the pairs of letters AA and AS. They have equal chance of appearing in the first two letters (0.148%) of a random sequence. However, in a random three-letter sequence, AS has a 0.290% chance of appearance, compared to 0.284% for AA.

Despite the complication, there is still hope for our analysis of the monkey that ceaselessly types random letters. We can estimate a very conservative lower bound on the probability by dividing the sequence of n letters into n/k non-overlapping blocks. This basically assumes that the string we're searching for must start at some multiple of k-letters into the full sequence.

Conservative lower bound probability

Now it'd be nice if we had an upper bound on the probability. I can't prove that this is an upper bound, and it might not necessarily always be an upper bound, but I think that it is probably likely to be an upper bound. Instead of assuming there are n/k independent trial starting points, let's assume that every letter is an independent trial starting point. Then subtract (k -1) so that we eliminate the final few letters as possible starting points (because if you start fewer than k letters from the end, you can't possibly complete the string). To give an example, if the string is PAS, you can't possibly get PAS at the end of a random letter sequence if the third-to-last letter is not 'P'. So that gives us an estimated upper limit of n - k + 1 independent trials.

Upper bound (?) probability

The limit of both of these equations as n approaches infinity is 100%. This confirms that after typing a sufficient number of letters at random, the probability that you happened to type some finite string of letters approaches 100%.


We can also take the upper and lower bound probability and estimate the number of letters the monkey would have to type to achieve a given probability of  success.

The high estimate of n, based on the low estimate of p.

The low estimate of n, based on the high estimate of p.

Total number of letters required in the sequence to ensure a given probability of matching a string of k letters.

So is there any conceivable way we could actually type something like Hamlet at random? Let's forget about our metaphorical monkeys now and discuss this in terms of computing power. CPU speeds today are commonly on the order of 3 GHz. A computer with a 3 GHz CPU would not actually be able to generate random letters at a rate of 3 billion per second, but I'll be very conservative anyway to demonstrate how unlikely it is that the randomly duplicated work of fiction will ever exist. Let's assume that our computers will be able to generate random letters indefinitely at a rate of 3,000,000,000,000,000,000 (3 billion billion) letters per second. According to this 2008 article, there were over 1 billion PCs in use at the time and there would be an estimated 2 billion in use by 2014. So let's be really conservative and assume that we employ 4,000,000,000,000,000,000 (4 billion billion) computers with the task of generating random works of literature. I'll even use the upper bound probability estimate here. How long would it take before we had a reasonable probability that at least one computer matched a particular string of k letters at least once? Well putting it all together gives us this lovely looking equation to estimate the probability of success at any time t (in seconds) after embarking on this endeavor:

Approximate probability of success after t seconds in our hypothetical scenario.

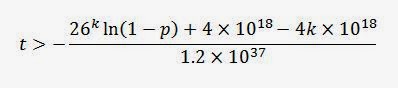
Solving for t from the approximate equation above gives us:


Which gives us an estimated lower bound time limit on matching a particular string of k letters. The number of years it would take before we could reasonably expect a duplication of Hamlet is still mindbogglingly large (it contains 187,694 digits!). The estimated age of the universe is only an 11 digit number of years (about 13.8 billion years). Even matching a complete sentence would take thousands of years.


Okay, let's give it one more chance. Surely the universe could duplicate Hamlet if we could enlist alien races to help out. The number of stars in the universe is estimated to be between 10 to the 22nd and 10 to the 24th powers. Let's take 100 times the high estimate and assume 10 to the 26th power. Now let's assume that 10 intelligent races exist around each star and match the computing power from our previous hypothetical scenario, and that we all coordinate to devote our total computing power to duplicating Hamlet by random letter selection. So in a grand universal waste of time, effort, and resources, we've employed {4 followed by 45 zeroes} computers spitting out random letters at a rate of 3 billion billion letters per second each. Now p and t are:


And we still can't duplicate Hamlet within 100 billion years with only a 1 in 1,000,000 probability. In fact, we probably can't even duplicate a short paragraph.

Conservative estimate of the minimum time required to match a particular string of k letters
with given probability using the universe's combined computing power.

So there you have it. By the Infinite Monkey Theorem, duplication of Shakespeare's work is possible with enough computing power. However, actual duplication is practically impossible from a physical perspective.

Epilogue

In 2003 the University of Plymouth actually spent grant money (about 2,000 British pounds, equal to about $3,270 USD or $4,580 CAD at the time) to give a computer to six macaques for a month and study their "literary output". The monkeys produced only five pages of text, apparently were fond of the letter 'S', and preferred using the computer as a lavatory to doing any actual typing. Even when they were typing, they made lousy random letter generators. Some confused creationists, such as this one, have used the results of this "study" as evidence against evolution. First, they fail to recognize that the monkeys in the "infinite monkey theorem" metaphor are meant to represent unthinking generators of random events, not actual monkeys. Actual monkeys do not act randomly. Their past experiences and their environmental conditions will influence their actions. Second, the study involved only six monkeys sharing one computer for only one month. That's hardly enough time or "monkey power" to generate a random string of letters long enough to expect anything resembling a word, let alone an entire work of fiction. Anyone who thinks this study tells us anything useful about the infinite monkey theorem is making the absurd assumption that either six monkeys is approximately equal to infinite monkeys or one month is approximately equal to infinite time.

Saturday, 31 August 2013

Are Humans Devolving?

I occasionally come across people arguing that advances in modern science and technology have halted human evolution and that we are now devolving as a species. The basic argument goes something like this: millions of people who would've died because of allergy, disease, birth defect, injury, etc. now survive and reproduce. Therefore, their weaker genes are contaminating the human gene pool and we've defeated natural selection. Sounds reasonable, right? Everyone's familiar with the phrase "survival of the fittest". The survival of weaker people must be a bad thing. 
And this will probably happen. It's "science". 
This argument bears striking resemblance to the reasoning used to justify various compulsory sterilization and euthanasia programs of the early 20th century. However, eugenics has largely disappeared and is now widely considered to be immoral. The Charter of Fundamental Rights of the European Union prohibits eugenics-based practices explicitly. Though the immorality of eugenics doesn't refute the argument that humans are devolving, perhaps it is a clue that the reasoning behind eugenics is flawed. 

I haven't actually taken any biology courses, so I'm probably unqualified to address the devolution argument, but it seems to me that it indicates an oversimplified view of what evolution really is. Suggesting that we no longer evolve is basically saying that humans are a special class of life that breaks all the rules when it comes evolutionary biology. In which case, the theory of evolution requires some significant revision to account for the anomaly that is humanity. 
Aside: I hope that no creationist cherry-picks this blog post for anti-evolution causes.
The phrase "survival of the fittest" is an elegant way to describe natural selection, but perhaps it does so too succinctly and is too easily misinterpreted. The argument that because we co-operate to cheat death we've somehow halted our evolution inherently assumes that "fitness" refers only to physical strength and robustness. When Darwin used the phrase, "fittest" was intended to mean "best adapted for life in their local environment". 

Physically weaker members of a species often still reproduce. In fact, this probably contributes to the species' overall viability by increasing genetic diversity. There is a misconception that in species living in hierarchical groups controlled by alpha males, the alphas do all the mating and all the other guys die bachelors. While alpha males typically mate far more frequently, other males still manage to sneak in a few trysts to pass on their genes. You might say that having the cunning to pass on genes despite inferior strength indicates greater intellectual fitness. Brain overcoming brawn. Clearly, physical fitness is not the only way for a species to survive and reproduce in its environment. 

To elaborate on the importance of intellectual fitness, let's look at tool use. We've mastered the use of tools, but we are not uniquely endowed with this ability. Sea otters use rocks both for prying abalone and to break open their hard-shelled prey. Chimpanzees use sticks to fish for termites, sharpened sticks to spear Senegal bushbabies (which are nocturnal primates, not Senegalese infants), and stone hammer and anvil to break open nuts. Capuchin monkeys also use stone hammer and anvil to break open nuts and seeds. Elephants use sticks to swat flies and chewed up tree bark to plug holes dug for groundwater (preventing evaporation). 
In addition to bashing shellfish with rocks, sea otters do adorable things like hugging their offspring.
Animals capable of tool use have evidently benefited from intellectual fitness during their evolutionary history. Some of these animals would probably not survive if tools were suddenly unavailable today. Yet believers in human devolution don't seem to think that sea otters are also devolving because a lot of them would starve to death if appropriate oyster-smashing rocks became unavailable for some reason. Antibiotics and epi-pens similarly don't reverse human evolution simply because some of us couldn't survive without these tools. 

Creatures can evolve traits to better equip them for survival in their environment, but they can also evolve the intelligence to manipulate their own environment to make it more survivable. Tool use is just an example of manipulation of one's environment, something that many living things do to various extents. Gorilla traps are something humans have added to the gorilla environment. The gorillas need not evolve traits to make them more difficult to ensnare because they already possess the intellectual fitness necessary to dismantle the traps and teach this skill to the younger generations. In other words, the gorillas manipulate their environment to remove a threat to the survival of their species. Fundamentally, this is hardly different from the human campaign to eradicate polio. 
With humans devolving and apes spearing bushbabies and dismantling snares, this scenario is inevitable.
While our ability to manipulate our environment has progressed far beyond the basic tool use seen in the animal kingdom, our quest for survival is fundamentally the same as any other creature's. The fact that we cannot survive outside the artificial environment of our making doesn't mean our evolution has halted. It is the environment humans actually live in that matters, not the fantastical universe where intelligence is eschewed and human survival is decided by physical fitness alone. In the developed world, the reality is we've created an environment where nutrition is optimal, children are (usually) vaccinated against preventable diseases, and antibiotics and epi-pens are readily available. Under such survivable conditions, it is to be expected that physical fitness becomes less important and what might have been "weaker" genes in the past start to make their way back into the gene pool. The belief that the increase in reported cases of asthma and allergies in children in the industrialized world signifies a devolution of the species is misguided. A rise in the prevalence in peanut allergy is simply to be expected wherever peanut allergy becomes more survivable, because the genes responsible for the condition are no longer a significant threat to fitness. 

Our abilities to co-operate and to manipulate our environment, i.e. our intellectual fitness, serve us far better than our physical fitness today. I think the expectation should be that humans will gradually become smarter as a species while simultaneously making the human environment increasingly survivable. It's what we've been doing for all of documented history (and for a long time prior, too). That hardly seems like devolution to me.

Saturday, 24 August 2013

Natural: Not a Synonym for Healthy

More and more I hear and see the word natural used to market products under the premise that natural things are good for you. Why should people equate natural with healthy? There are a plethora of things that occur naturally and are harmful to us. Asbestos; harmful elements like mercury, lead, arsenic, and radon; plus poisons like amatoxin, botulinum toxin, tetrodotoxin, ricin, tetanospasmin, taicatoxin, and PhTx3 can all be found in nature. Furthermore, how much of our food is truly natural? Even the most basic foods we eat are unnatural. We've hybridized nature's wild fruits, vegetables, and grasses to create nearly all modern crops, artificially increasing yields, edibility, and nutritional value. We've taken nature's wild animals and bred them selectively to artificially make them dumber, more docile, more productive, and meatier. When wild animals see the bountiful feasts we've created for ourselves, they are enticed to take it for themselves. After all, what creature wouldn't want to exploit a new food source which is both plentiful and nutritious? So we have to fight back against birds, rodents, insects, and other natural invaders to preserve our artificially enhanced food sources. Without our intervention, all of the crops and domesticated animals of our creation would disappear. 
Given the opportunity, this robin and his pals will gorge themselves on orchard cherries.
It's difficult to make the argument that we were better off before we started artificially enhancing the human environment. We are smarter, larger, healthier, more comfortable, and have greater longevity than ever before. I doubt that very many of the people buying into the "all-natural" trend would agree that we'd all be better off if we stopped adding Vitamins A & D to milk, iodine to salt, and folic acid to flour. 
Flour fortified with folic acid helps prevent Spina Bifida, much to the chagrin of today's all-naturally fed mothers.
Perhaps instead of letting the latest trend decide for us what is and isn't healthy, we should trust scientific evidence and the people qualified to interpret that evidence. Certified organic food isn't healthier than the regular stuff. There's no significant difference between milk produced by dairy cows and milk produced by dairy cows on the growth hormone rBST. High-fructose corn syrup doesn't hinder weight loss or cause weight gain (consuming too many calories does). 

Even worse than the use of the word natural to market overpriced foods is its use to market herbal supplements. Sure, we've been using some herbal remedies for thousands of years. The efficacy of some natural remedies, like willow bark, is well established and led to improvements in modern medicine.
Powdered willow bark might work, but I'm not convinced it's better for me than Aspirin.
Many other remedies, however, haven't been subjected to the same scientific scrutiny. Herbal supplements don't need to be effective and they don't need to be approved by a regulating body before hitting the market. Health Canada basically only requires that the ingredients of an herbal supplement be labelled correctly and that the stuff doesn't pose a significant health risk if taken as directed. The U.S. FDA has essentially the same relaxed rules. While many supplements are probably harmless, there are a few that could be dangerous. St. John's Wort might help with mild depression, but there isn't enough evidence to use it to treat major depression and it isn't more effective or significantly better tolerated than other antidepressants. Plus, it interacts with a number of different drugs, including oral contraceptives. Comfrey helps heal damaged skin and bone, but its toxic effects on the liver resulted in the FDA banning comfrey preparations intended for ingestion. Kava might help with your anxiety, but it often takes several weeks to start working, and some possible adverse effects include liver damage and dangerous interactions with alcohol and other drugs. Those are just three examples of supplements that have received enough attention to identify some of the risks. There are hundreds of untested, barely regulated supplements out there being marketed with unsubstantiated claims of significant health benefits, and new ones are coming out all the time. Without the clinical testing required of real medicine, the harmful effects of herbal supplements can go undetected longer and affect a much larger number of people. Remember, just because something's been around for a long time doesn't mean that it's right. 

In conclusion, the next time you see the word natural associated with a food or supplement, keep in mind that natural does not equal healthy, many artificial enhancements have made our lives better, and that the word natural has probably been placed there just to sucker you out of some money.